Genetic Tools for Sea Turtle Conservation
By Michael P. Jensen, F. Alberto Abreu-Grobois, Brian M. Shamblin, Kelly R. Stewart, Erin L. LaCasella, Nancy N. FitzSimmons, and Peter H. Dutton

A flatback turtle in Australia. Researchers have identified seven genetically distinct flatback management units. © Doug Perrine
On tropical and subtropical beaches around the world, female sea turtles have come ashore to lay their eggs for millennia. When the young turtles scurry down the beach to the ocean, they carry their parents’ DNA. If they survive to adulthood, the females return to the same spot to lay their eggs in a process known as natal homing, which was first hypothesized by Archie Carr in 1967. As a result, females nesting in the same region are genetically similar to one another and dissimilar to those in other regions.
Over the past 30 years, genetic tools have helped researchers to understand how sea turtle populations are connected across time and space and have further taught us that the precision of natal homing varies among species and regions. Researchers are learning how demographic, behavioral, and environmental forces shape gene flow among rookeries, plus the implications this information has for identifying appropriate population units for conservation purposes. Rapid advances in genomic technologies and analytic methods have given scientists a means to differentiate among genetically distinct sea turtle groups at increasingly finer scales.
Defining Management Units
Sea turtles have complex life histories; they are long-lived and take decades to reach sexual maturity. Throughout their lives, they occupy widely dispersed oceanic and coastal areas as their ecological needs change. Young turtles from the same nesting beach may end up in distant foraging areas, and foraging areas may host a mix of turtles from widely dispersed rookeries. Addressing such complexity for successful conservation and management is challenging because individual populations need to be identified, evaluated, and monitored across all life stages and habitats. Tagging and satellite telemetry partially address those challenges but can be impractical. Genetics therefore plays a vital role in obtaining reliable, detailed information about sea turtle population structure and behavior.
Natal homing behavior promotes the differentiation of DNA between rookeries, which can help to define genetic stocks or management units (MUs). The MUs are based on significant differences in the distribution of mitochondrial variants (haplotypes) inherited from the mothers or from nuclear DNA (nDNA) alleles inherited from both parents. MUs represent the appropriate scale for monitoring changes in population abundance and assessing threats because individuals lost in one MU are unlikely to be replaced by individuals from another MU. Therefore, the first step in informing effective management decisions is to determine which rookeries to consider as part of a single breeding population and which to consider as separate populations.
A 1992 landmark study led by Brian Bowen provided the first global view of the genetic variation in sea turtles; since then, our understanding of population structure for all sea turtle species has improved enormously. For green turtles, we researchers have advanced from 14 MUs in 1992 to more than 76 MUs today (see maps below). Early studies suggested that rookeries less than 500 km (311 mi) apart were not genetically distinct, but more comprehensive sampling continues to reveal more complex patterns of female natal homing and dispersal. We now know that genetic diversity and population structure can vary greatly between species and regions and at unexpectedly fine scales, such as between hawksbill rookeries on either side of Barbados (a distance of 30 km or 19 mi) or green turtle rookeries on opposite sides of a single Florida inlet!
At the same time, olive ridleys nesting in arribadas at Ostional, Costa Rica, are indistinguishable from those nesting at Escobilla, Mexico, more than 1,300 km (808 mi) away. Widespread leatherback turtles are characterized by low genetic diversity globally, and they have fewer rookeries than other marine turtle species. Green turtles, meanwhile, are one of the most globally abundant and widespread of all sea turtles, which is reflected in more MUs (76 and counting) and greater genetic diversity.
A genetic marker is a DNA sequence with a known physical location on the genome. Our use of novel genetic markers improves how well we can detect population structure. Thirty years ago, the first studies about genetic structure in sea turtles used expensive restriction enzymes to cut mitochondrial DNA (mtDNA) and to define haplotypes that were based on gel band patterns, although much of the genetic variation remained hidden. This effort improved with sequencing technology in the late 1970s but was still difficult and expensive; the generation of even short stretches of sequences (approximately 400 base pairs [bp] at first) was a reason to celebrate! This approach later expanded to approximately 800 bp of the mtDNA control region. More recent work found variation in a hypervariable repeat segment inside the control region that revealed a population structure among Mediterranean green turtle rookeries that was undetectable before.
Now, with sequencing of the entire mitogenome (16,000 bp), a variation that subdivides control region–defined haplotypes into additional variants can be seen. We now know, for instance, that Caribbean green turtles with the 400 bp haplotype CM-A5 represent at least 30 different female family lines, thereby providing even more power for the fine-scale definition of nesting populations.

A researcher draws a blood sample from a flatback turtle on Curtis Island, Queensland, Australia. Tools for genetic analysis have both advanced and become vastly cheaper in recent years, making detailed genetic studies much more feasible than before. © Doug Perrine
Making Connections
Once the genetic signature of rookeries has been characterized, the data can be used to determine the origins of turtles sampled far away from the nesting beaches in migratory routes or foraging areas or from live or dead animals impacted by humans. For example, studies show that loggerheads encountered as fishery bycatch in the North Pacific and in foraging grounds off the coast of Baja California, Mexico, all originate from rookeries in Japan. Research on green turtles foraging at Australia’s Great Barrier Reef has been used to show how recruitment of juvenile turtles into foraging areas has changed over time and how the changes can be directly linked to reduced hatching success at Raine Island.
Monitoring: Collaborations Are Key
Knowing what proportion of turtles from different MUs is present in shared habitats is vital for conservation planning, because the mortalities in such areas may affect several distant MUs. The power of genetic tools and methods depends on how well sea turtle monitoring can fulfill two key criteria: (a) sampling all or most of the MUs found in shared habitats and (b) ensuring the accuracy of all MU definitions. Such knowledge underscores the importance of continued genetic sampling of all sea turtles wherever they occur, a task that requires global-scale collaboration among a multitude of partners.
Data for several key nesting populations are currently unavailable, too old, or limited by small sample sizes, thereby preventing reliable assessments of MU boundaries. As more laboratories embark on their own sea turtle research, all researchers must strive to work together to develop the highest levels of technical capacity, to create standardized methods, to share research protocols and priorities, and to identify funding so that we can ensure that the most critical conservation challenges are being addressed.
Most importantly, networks among experts must continue to thrive in order to encourage data sharing and to support global marine turtle management and protection efforts. An excellent example of one such network is the Asia–Pacific Marine Turtle Genetics Working Group, which convenes dozens of researchers from across that vast region through frequent workshops and other networking opportunities to enhance in-country capacity for marine turtle genetic studies.
Ensuring the Future of Stock Identification
Genetic research has come a long way since the cumbersome days of restriction fragment length polymorphism or radioactive staining of microsatellite loci! Only 20 years ago, sequencing the sea turtle genome would have taken 13 years and cost US$300 million. Today, a complete genome costs as little as US$1,000 and can be sequenced in a single day on a machine that fits in the palm of a hand. As genetic tools become more affordable, the capacity of researchers to do detailed studies is no longer restricted to a few well-funded laboratories. High-quality reference genomes have been published for green and leatherback turtles (see “What Makes a Sea Turtle” from SWOT Report, vol. XVI); genomes for all other sea turtle species are expected to be completed within the next two years. Those advances will usher in a new era of whole-genome sequencing and the development of inexpensive assays that will democratize the use of genomics for sea turtle biology and conservation. It will allow us to vastly refine our understanding of sea turtle boundaries and the impacts of threats and to focus sea turtle conservation efforts in targeted ways that were impossible in the not-too-distant past.
Maps: Global Management Units for Sea Turtles
The following maps display global nesting sites and known management units (MUs) for each sea turtle species based on mitochondrial DNA. Individual nesting sites with available genetic information are shown with colored symbols; sites that belong to the same MU share a color. Given the large number of MUs globally, colors may repeat both within and between species maps. Management units can be explored in detail at the SWOT Online Map application. Sites that have been sampled but not yet assigned to an existing stock are colored gray. Data for the maps were sourced from the SWOT team and reviewed literature; see complete data citations here. A legend is provided below the maps.

Loggerhead turtle management units. Of 805 documented nesting sites, 62 rookeries have been genetically sampled, and 26 MUs have been identified. Undersampled regions include the Northeast Indian Ocean.
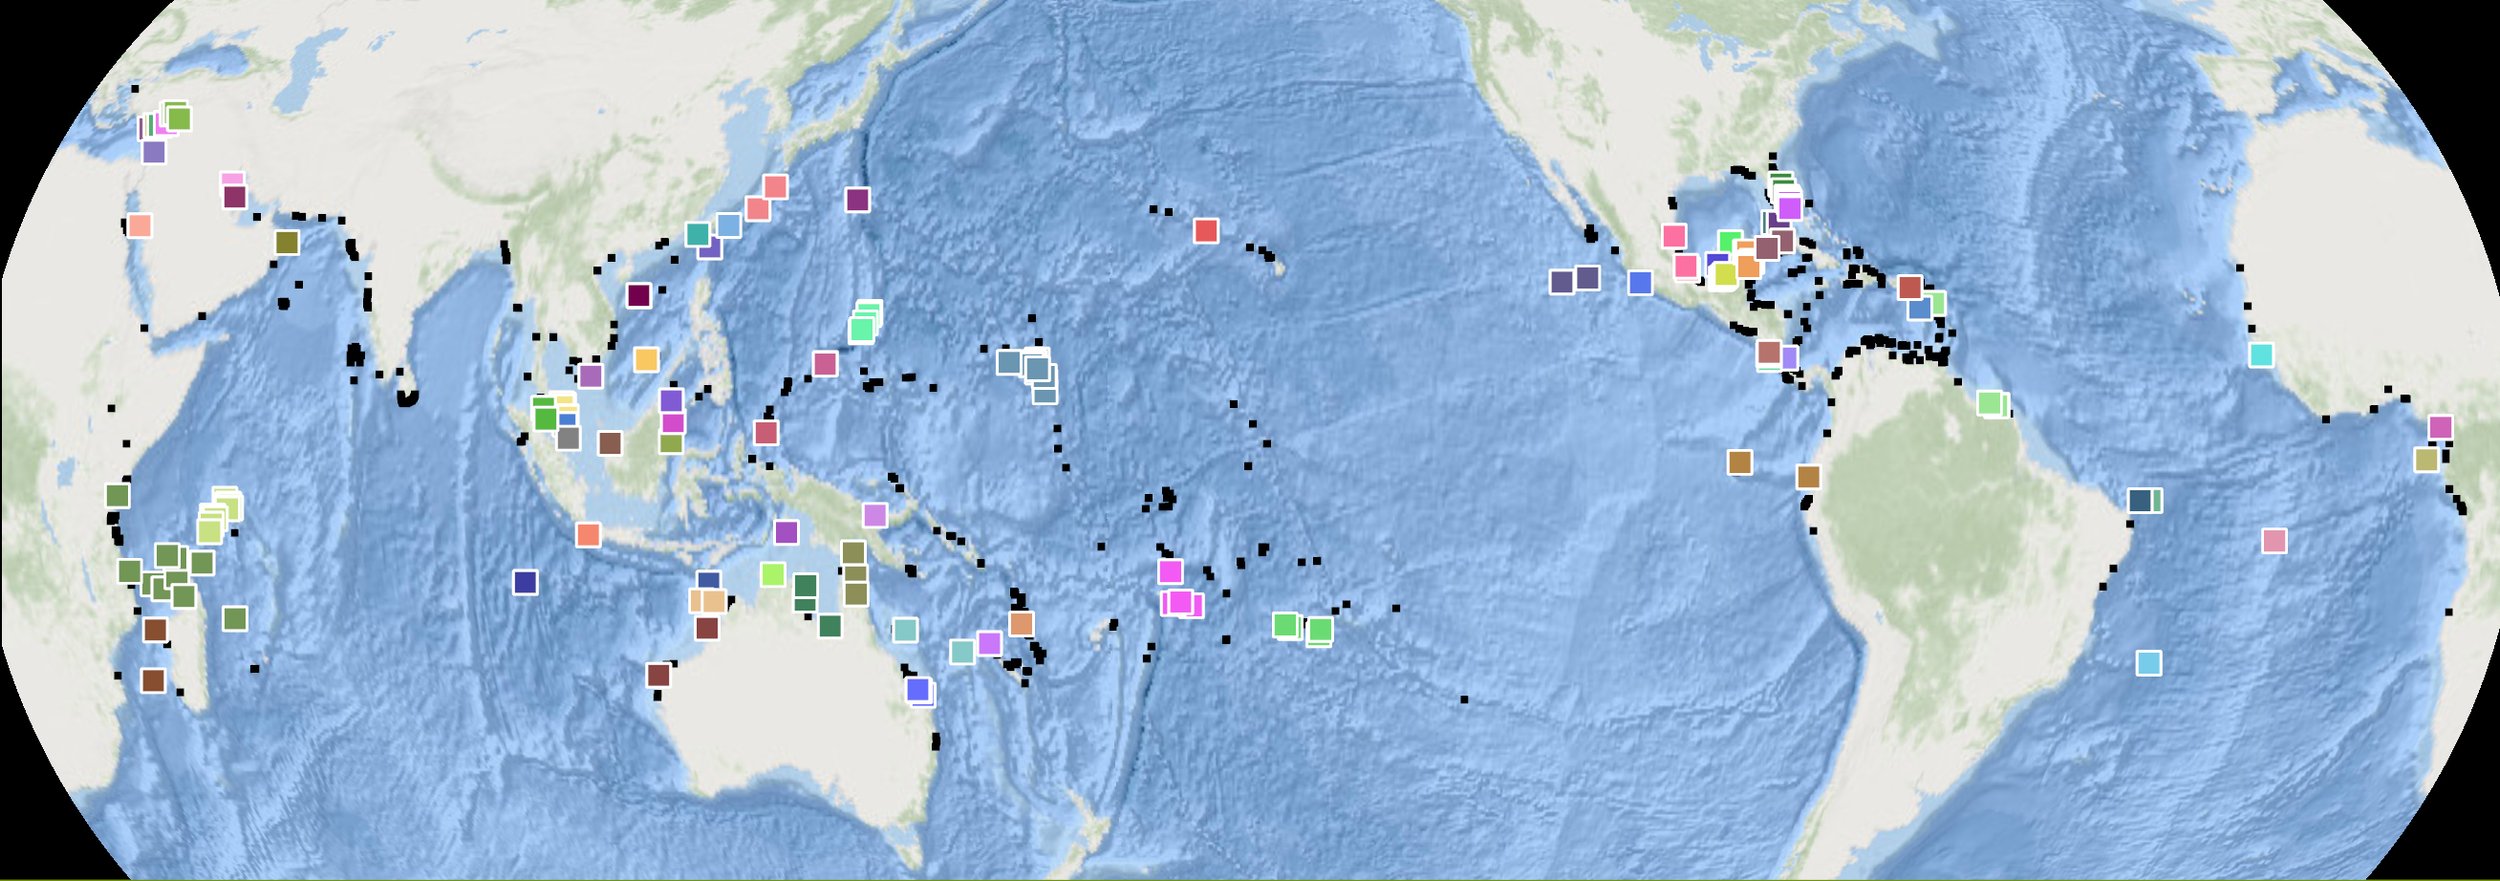
Green turtle management units. Of 1,568 documented nesting sites, 164 rookeries have been genetically sampled, and 76 MUs have been identified. Undersampled regions include parts of Southeast Asia, the Red Sea, the Northeast Indian Ocean, East Africa, and the East Pacific.

Leatherback turtle management units. Of 889 documented nesting sites, 26 rookeries have been genetically sampled, and nine MUs have been identified. Undersampled regions include parts of Southeast Asia.

Hawksbill turtle management units. Of 1,650 documented nesting sites, 72 rookeries have been genetically sampled, and 30 MUs have been identified. Undersampled regions include West Africa, the Red Sea, the North Indian Ocean, Southeast Asia, and the Southwest Pacific.

Olive ridley turtle management units. Of 494 documented nesting sites, 33 rookeries have been genetically sampled, and 17 MUs have been identified. Undersampled regions include the northeast coast of South America, West India, Pakistan, and Southeast Asia.

Kemp’s ridley turtle management units. Of 67 documented nesting sites, 9 rookeries have been genetically sampled, and one MU has been identified. Undersampled regions include the Southern Gulf of Mexico.

Flatback turtle management units. Of 225 documented nesting sites, 17 rookeries have been genetically sampled, and seven MUs have been identified. Undersampled regions include Northeast Arnhem Land, Australia.
MAP Legend — global management unitS

Base maps: Ocean Basemap—Esri, DeLorme, GEBCO, and NaturalVue
Projection: Eckert IV
Produced in partnership with: Oceanic Society, OBIS-SEAMAP, and the IUCN-MTSG
This article originally appeared in SWOT Report, vol. 17 (2022). Click here to download the complete article as a PDF.
Author Affiliations
MICHAEL P. JENSEN, Department of Chemistry and Bioscience, Aalborg University, Denmark, and Australian Rivers Institute School of Environment and Science, Griffith University, Australia
F. ALBERTO ABREU-GROBOIS, Instituto de Ciencias del Mar y Limnología, Universidad Nacional Autónoma de México, Mexico
BRIAN M. SHAMBLIN, Warnell School of Forestry and Natural Resources, University of Georgia, Georgia, U.S.A.
KELLY R. STEWART, Southwest Fisheries Science Center, NOAA-NMFS, California, U.S.A., and The Ocean Foundation, Washington, D.C., U.S.A.
ERIN L. LACASELLA, Southwest Fisheries Science Center, NOAA-NMFS, California, U.S.A.
NANCY N. FITZSIMMONS, Australian Rivers Institute, School of Environment and Science, Griffith University, Australia
PETER H. DUTTON, Southwest Fisheries Science Center, National Oceanic and Atmospheric Administration–National Marine Fisheries Service (NOAA-NMFS), California, U.S.A.